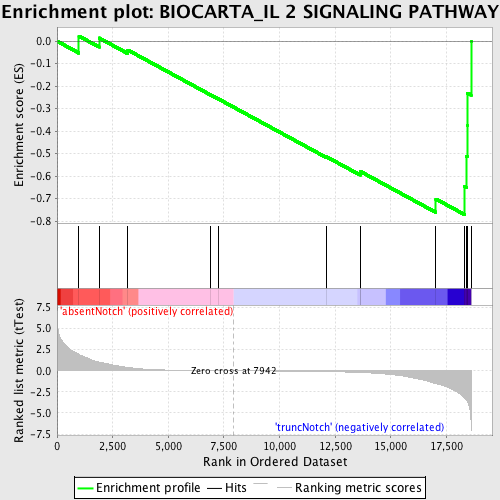
Profile of the Running ES Score & Positions of GeneSet Members on the Rank Ordered List
| Dataset | Set_03_absentNotch_versus_truncNotch.phenotype_absentNotch_versus_truncNotch.cls #absentNotch_versus_truncNotch.phenotype_absentNotch_versus_truncNotch.cls #absentNotch_versus_truncNotch_repos |
| Phenotype | phenotype_absentNotch_versus_truncNotch.cls#absentNotch_versus_truncNotch_repos |
| Upregulated in class | truncNotch |
| GeneSet | BIOCARTA_IL 2 SIGNALING PATHWAY |
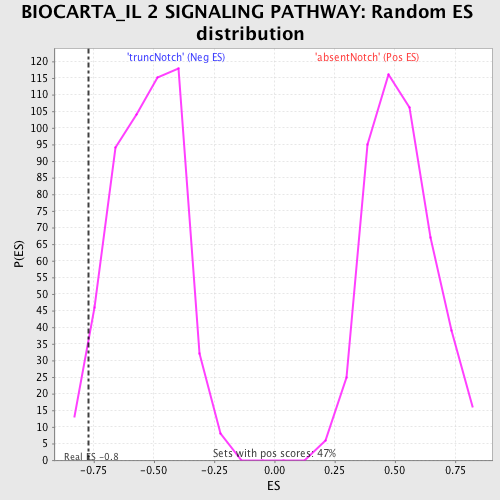
| Enrichment Score (ES) | -0.770971 |
| Normalized Enrichment Score (NES) | -1.4548494 |
| Nominal p-value | 0.03773585 |
| FDR q-value | 0.6214991 |
| FWER p-Value | 1.0 |
| PROBE | DESCRIPTION (from dataset) | GENE SYMBOL | GENE_TITLE | RANK IN GENE LIST | RANK METRIC SCORE | RUNNING ES | CORE ENRICHMENT | |
|---|---|---|---|---|---|---|---|---|
| 1 | GRB2 | 6650398 | 982 | 1.909 | 0.0227 | No | ||
| 2 | IL2RG | 4120273 | 1887 | 1.019 | 0.0144 | No | ||
| 3 | SHC1 | 2900731 3170504 6520537 | 3176 | 0.398 | -0.0391 | No | ||
| 4 | SYK | 6940133 | 6907 | 0.018 | -0.2389 | No | ||
| 5 | IL2 | 1770725 | 7272 | 0.011 | -0.2580 | No | ||
| 6 | SOS1 | 7050338 | 12089 | -0.096 | -0.5131 | No | ||
| 7 | JAK1 | 5910746 | 13622 | -0.207 | -0.5873 | No | ||
| 8 | STAT5B | 6200026 | 13637 | -0.210 | -0.5797 | No | ||
| 9 | LCK | 3360142 | 17025 | -1.510 | -0.7021 | Yes | ||
| 10 | IL2RB | 4730072 | 18307 | -3.163 | -0.6460 | Yes | ||
| 11 | STAT5A | 2680458 | 18406 | -3.478 | -0.5138 | Yes | ||
| 12 | JAK3 | 70347 3290008 | 18433 | -3.588 | -0.3733 | Yes | ||
| 13 | HRAS | 1980551 | 18441 | -3.618 | -0.2307 | Yes | ||
| 14 | IL2RA | 6620450 | 18608 | -6.074 | 0.0004 | Yes |